


What I'm Watching: Search Growth Is Slowing, the 10-Year Is Back Above 5%, and Chips Hit Resistance
What I'm Watching · October 29, 2026
This week's Chart Rooms kept coming back to one idea: the bounce is real, but the AI buildout is hitting walls. First it was money, with the biggest companies in the world selling stock and leasing chips to pay for it. Then equipment, with transformer lead times now running as long as 26 months. Last night added a third: the business that's supposed to pay for all of it is changing. Here are the three charts I'm keeping on my screen. They're through Wednesday's close, so treat the levels as the map, not the score.
Search Went From 19% to 12% in Two Quarters

Alphabet's Search revenue grew 19% in the first quarter, 17% in the second and 12% in the third. The Street wanted 15%. The stock fell as much as 10% after hours, to around $290 from a 324.89 close.
Alphabet pointed to currency, an EU rule change and a World Cup boost fading. But it also said AI Mode doesn't make as much money per search yet. And it isn't cutting spending. Capex rises significantly again next year.
Hans's take: Search was the best toll booth on the internet for 20 years. AI agents are building a road around it, and agents don't look at ads. More spending and slower search is a combination I'd rather sell premium on than own.
The 10-Year Is Back Above 5%
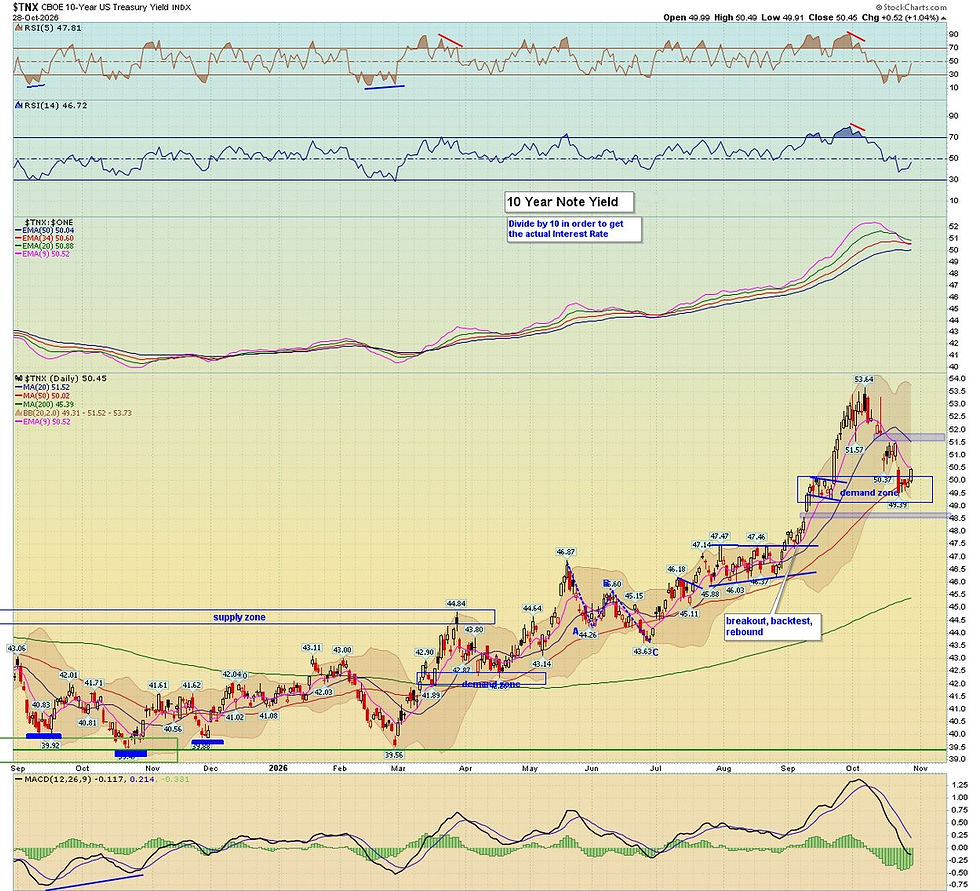
The 10-year rose to 5.045% on Wednesday, back above its 50-day and the 5% line. The Fed held rates steady in a 10–2 vote, and both dissenters wanted a hike, so December is still live. The October peak was 5.364%.
Hans's take: This is the financing wall in one number. Every dollar of AI capex that gets borrowed gets borrowed at about 5%, and every month a site waits on transformers is another month of interest on capital that isn't earning anything yet.
Chips Are Back at the 50-Day

SMH rose 1.74% to 567.67 on Wednesday, up about 9% from last Thursday's low (520.53), which came within a few points of the 200-day. It closed just under its 50-day (573.40) and 20-day (578.11). SK Hynix rose 13% after a record quarter and said memory supply stays tight.
Hans's take: Memory demand is the one part of the AI story nobody is arguing with. But 573 to 578 is real resistance, with Intel and Sandisk reporting tonight. Strength here is for selling premium, not chasing.
Put the three together and you get the market right now. Chips are bouncing on real demand, but money costs 5% and the biggest ad business on the internet just slowed. That's a bounce with walls around it, not an all-clear.
What I'm watching from here: how Alphabet trades now that it's below its 200-day and down near $290, whether the 10-year holds above 5%, and whether SMH can close above 573 to 578.
Want every chart, every night? The full Chart Room, every trade as I take it, and my read on volatility all day are inside Trader63, my pro trading community.
Trade smart, stay hedged. — Hans
This material is for educational and informational purposes only and is not investment advice or a recommendation to buy or sell any security. Options involve risk and are not suitable for all investors. Past performance does not guarantee future results.


Comments