


Hans's Chart Room: The S&P Is 3% From Its High. The Momentum Trade Is Down 41%.
Weekend Chart Room teaser · Sunday, October 25, 2026
Note From Hans
If all you saw was the S&P 500, you’d think nothing happened this week. It finished down 0.47% at 7,623.68, less than 3% below its record high. The Dow rose 0.4%, and the Russell 2000 gained 2%. The Nasdaq Composite slipped 0.7%.
Underneath, it was a mess. Meta lost 9.4% on the week, most of it on Thursday after its report. Chips fell 6% that same day, the Nasdaq had its worst day since June, and the 10-year had its biggest one-day drop since March 2023. Then on Friday the Dow dropped 652 points as oil jumped on reports that the U.S. and Israel may strike Iran again. WTI futures settled at $103.27 and Brent at $116.72, its highest close since April. Energy closed at a record, and even the defensive sectors (staples, utilities, health care) finished red.
Here’s what the index is hiding. Goldman’s high beta momentum basket, the crowded fast movers, is down about 41% from its peak. On Thursday, all three major hedge fund strategies Goldman tracks (fundamental long-short, systematic and multi-strategy) lost more than 1% on the same day, the first time that’s happened since the pandemic. Stock pickers are down 3.8% for October, and tech-focused funds about 10%. Hedge funds have been COOKED.
I think a lot of this is the market changing under their feet. More and more of the trading is done by agents and bots that react to the same headline in the same second, so a crowded trade doesn’t unwind over a month anymore. It unwinds in a day. Funds got hit on both sides on Thursday: their AI longs fell while their crowded shorts got squeezed. When the systematic funds lose too, it isn’t just the humans struggling to make sense of it.
This week brings the Fed on Wednesday, Microsoft and Alphabet that night, Amazon and Sandisk on Thursday, and core PCE Thursday morning.
The S&P Is Sitting on Its Trendline

The S&P 500 fell 39.75 (−0.52%) on Friday to 7,623.68, down 0.47% on the week. Friday’s low (7,612.07) slipped just under the October low (7,616.78) before it closed back above it, right on the rising trendline from the July low.
Look how much support is stacked here: the lower Bollinger Band (7,605.88) and the 100-day (7,603.69) are both within 20 points. The 50-day (7,699.64) is overhead. The record high is 7,844.52.
Hans’s take: 7,600 is the line for me. Options are pricing about a 1.9% move this week, roughly 7,475 to 7,775. Lose 7,600 on a closing basis and the September low near 7,500 is next.
QQQ Held 700 by a Dollar
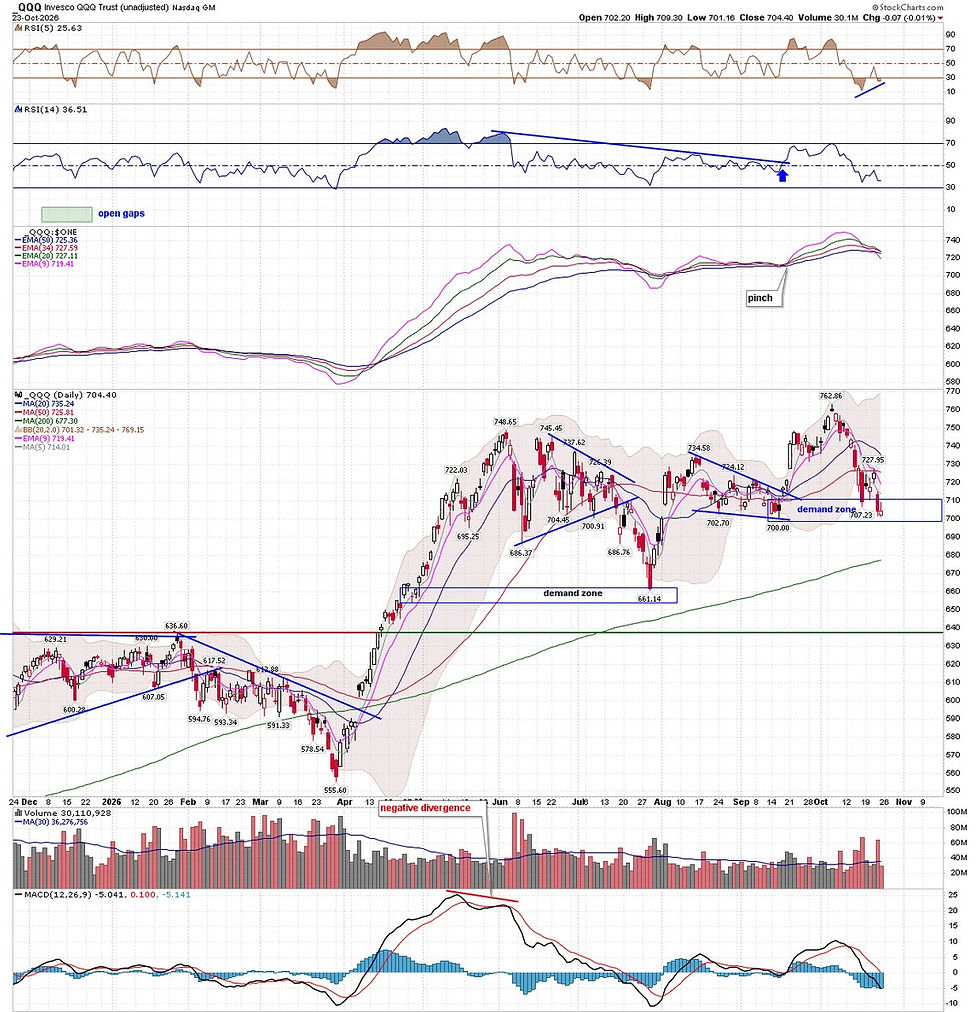
QQQ closed Friday at 704.40, unchanged on the day and down 0.76% on the week. Friday’s low was 701.16, a little more than a dollar above 700 and right at the lower Bollinger Band (701.32). It’s still inside the 700-to-710 demand zone, with the September low at 700.00.
The 50-day (725.81) and 20-day (735.24) are well overhead. The 200-day is down at 677.30.
Hans’s take: Above 700 is the rotation zone, and we’re still in it. A close below 700 and I treat it as the correlation zone, where even the winners get sold. With Microsoft, Alphabet and Amazon all reporting, this is the week that decides it.
Full Chart Room (all charts): https://drive.google.com/file/d/1DKSzmGtBbh3DZDhaA-JyH5etV9k-Vriz/view
Trade smart, stay hedged.
Hans Albrecht · Options With Hans
This material is for educational and informational purposes only and is not investment advice or a recommendation to buy or sell any security. Options involve risk and are not suitable for all investors. Past performance does not guarantee future results.

Comments